Access Point Tool
January 2026
Overview
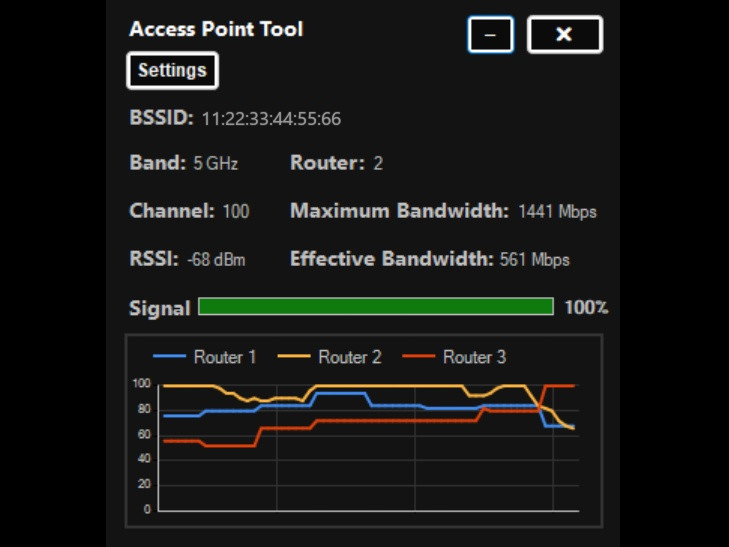
When I was configuring the new routers in my house to work as a seamless mesh network that gives the best possible connection in all parts of the house, I thought that an application that could show me information such as RSSI and bandwidth, as well as which router and band I was connected to at any given point, would be very useful during that process.
Getting Basic Information
To create this application, I used Visual Studio to write code in C# and Windows Forms for the UI.
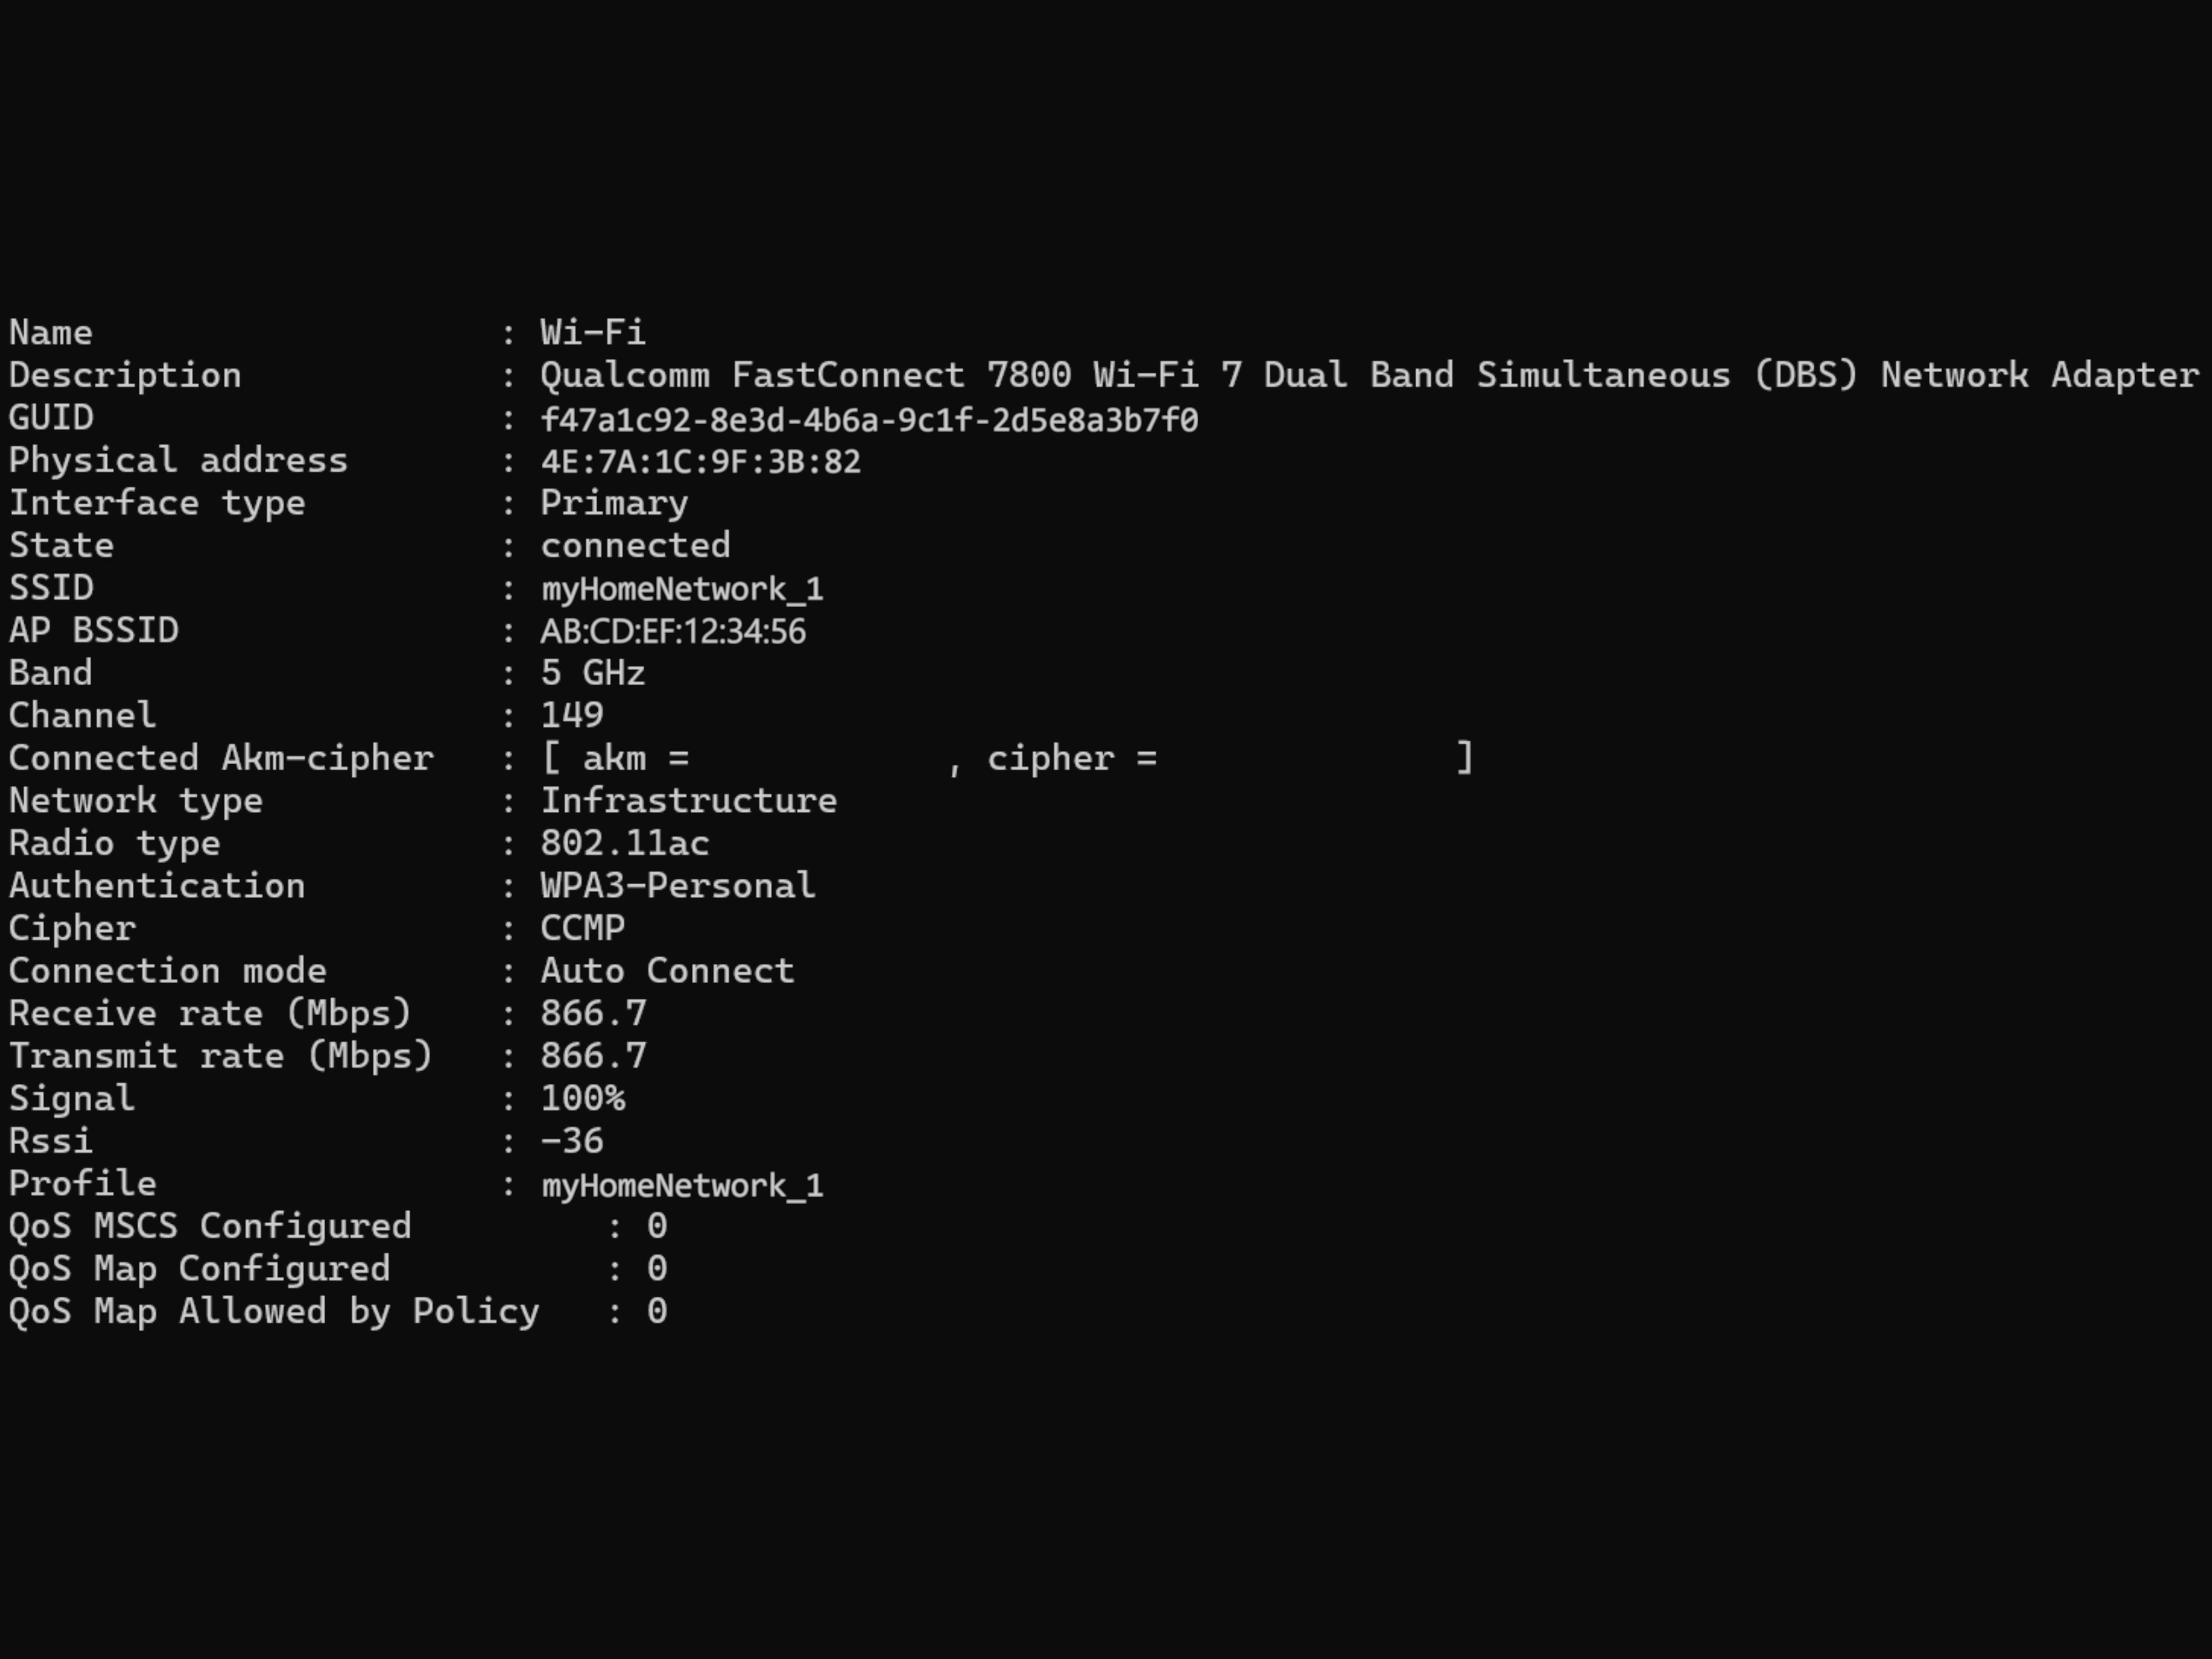
I used a built-in Windows command, netsh wlan
show interfaces, to get information about the router my device was currently connected to, such as BSSID, Band, Channel, Maximum Bandwidth, RSSI, and Signal Strength.
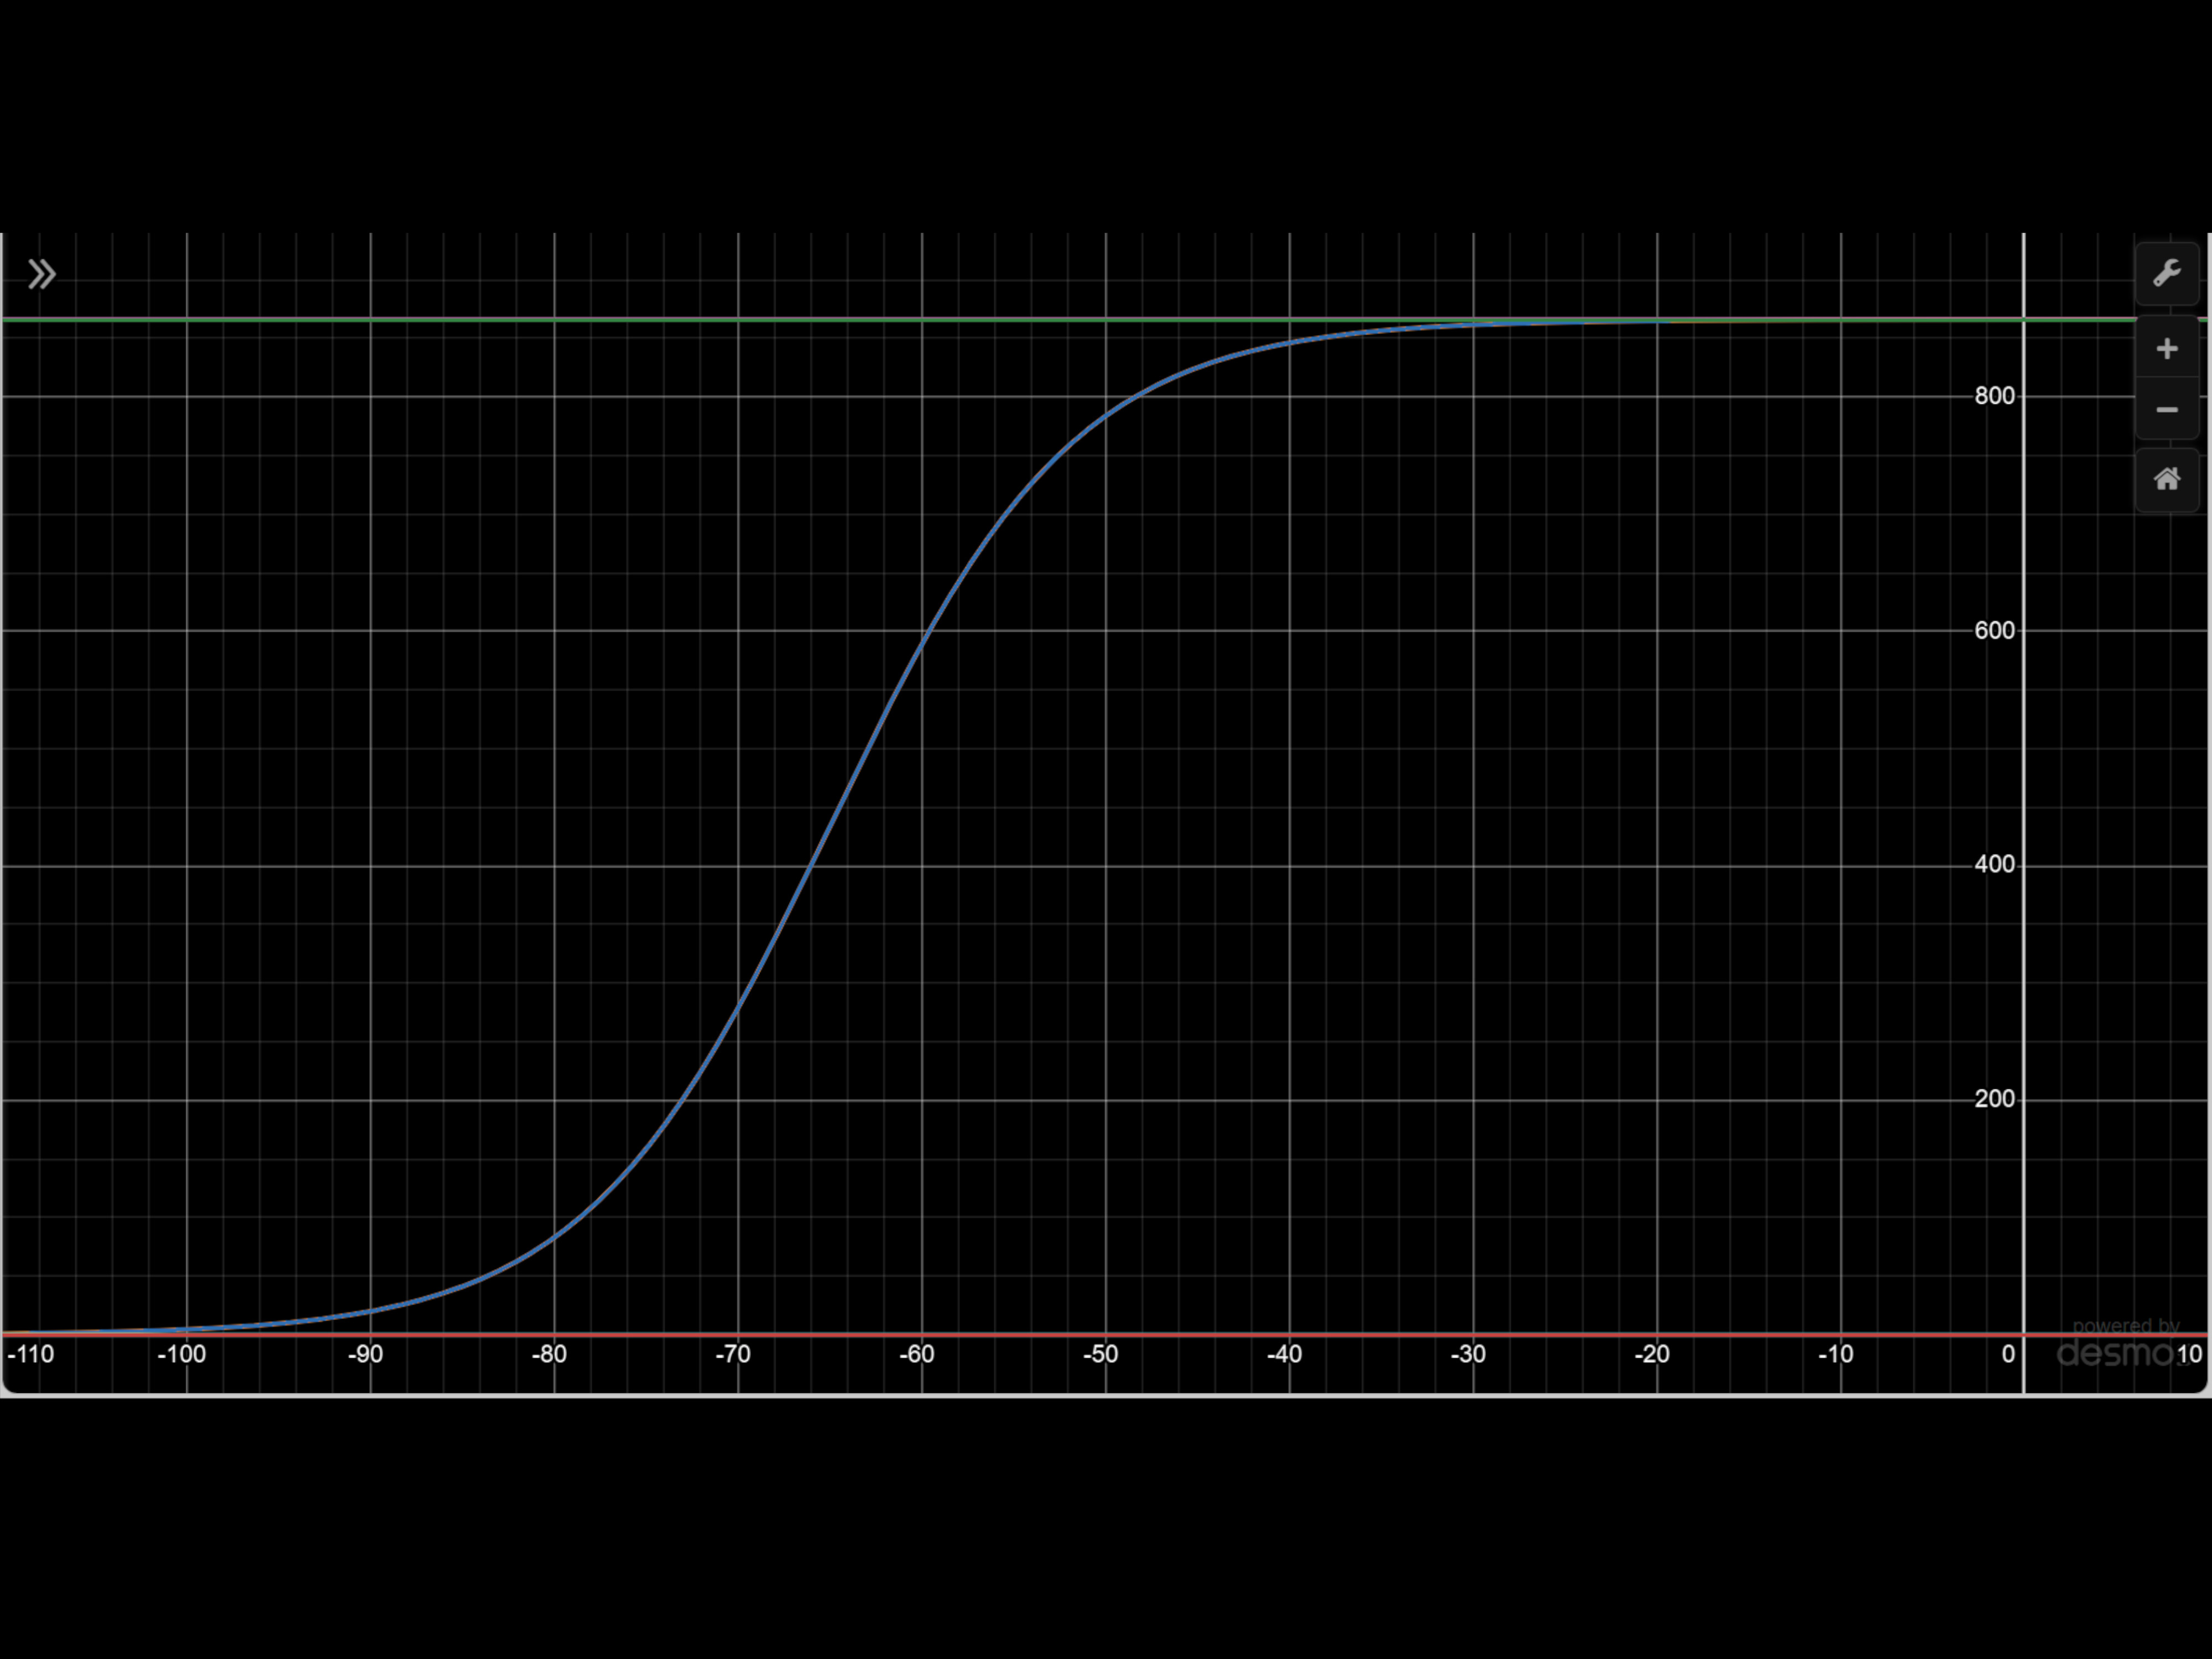
Using this information, I could also calculate the effective bandwidth based on RSSI by multiplying
the maximum bandwidth by a factor that is a logistic function of the RSSI. I used AI to give me the initial
constants for the equation, and then further tweaked it using Desmos and Speedtest to verify its accuracy.
The final function was maxBand * (1.0 / (1.0 + Math.Exp(-0.15 * (ParseRSSI(output) + 65)))).
Router Identification
I wanted to be able to identify which router I was connected to at any given point by assigning each router a number, being able to save router identification information, and later comparing against that information to display which router the device was connected to.
I did this by creating a separate settings page where I could add and remove routers, and also save the information of each router.
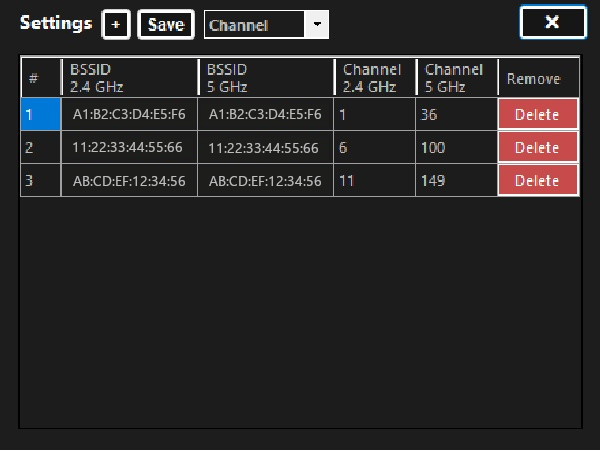
On this page, you can add and remove routers, and enter seperate BSSIDs and Channels for both bands of each router. You can also select whether you want the router to be identified based on Channel or BSSID. To save all this information, I used the Newtonsoft.JSON library to store it in a JSON file.
Graphing Signal Strength
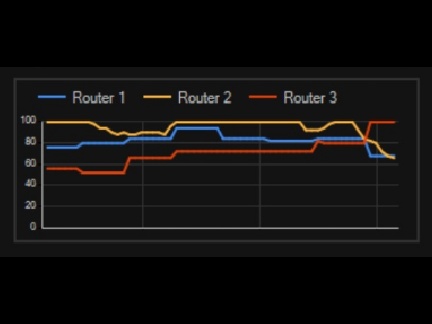
Finally, I added a graph to be able to monitor the signal strength of every router on the list live. I did this using a line graph with a line graph with a different colored line for each router. This allowed me to see in real time where there were weak spots in coverage and optimize the settings on each router.